I turn messy data into meaningful insights
— powered by curiosity, Python, and coffee.
Explore projects with real-world data analysis, model development, and storytelling with data
About Me
I’m a data analyst with a nonlinear path and a practical approach.My background spans marketing, AI model training, and hands-on analytics using Python. I’ve contributed to LLM development through human-in-the-loop workflows, from prompt evaluation and fine-tuning to data labeling and QA.I hold certifications from Google and IBM in data analytics and data science, with a strong focus on Python, pandas, wrangling, visualization, and machine learning. My portfolio reflects this training through:
Exploratory analysis and ML Model Development
Dashboards and data visualizations
Case study–style problem solving
I care about clarity, context, and code that communicates.
Whether cleaning a messy dataset or presenting insights, I bring a structured, story-driven approach to problem-solving.

Featured Projects
I use code to explore, explain, and solve. These projects reflect the questions I like to ask and how I work through data to find useful answers.Each project in my portfolio begins with a real-world question and ends with structured insights, backed by analysis, model training, and/or visualization.

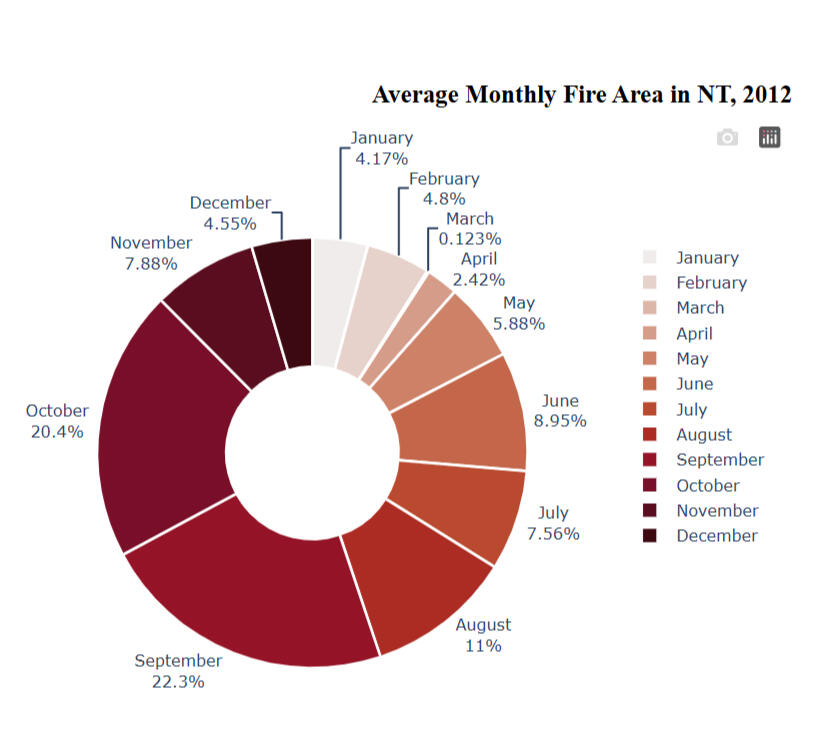
Australian Wildfire Analysis with Data Visualization & Dashboard
Analyzed satellite fire data to uncover regional patterns, time series trends, and fire behavior during peak seasons. Built a Python dashboard to explore fire counts and brightness levels across states and time periods.
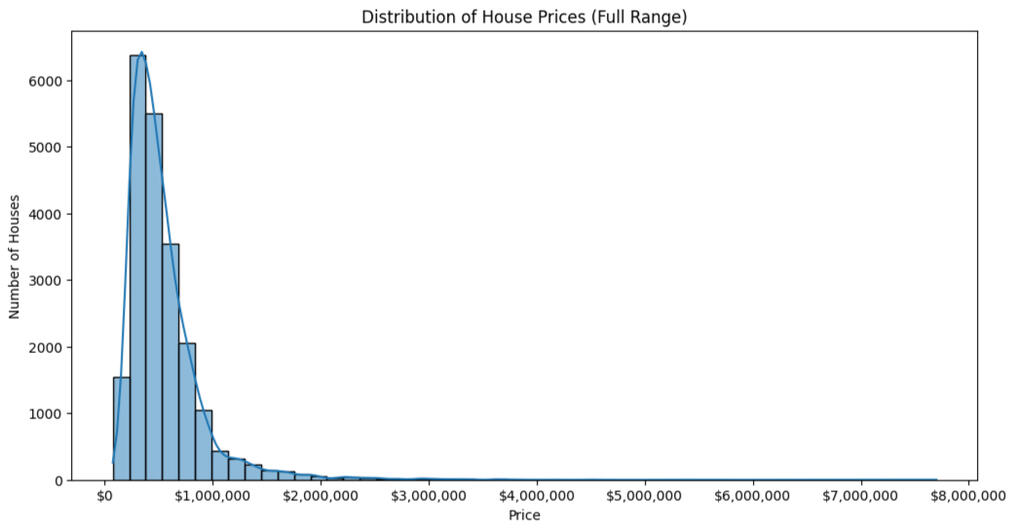
Housing Price Prediction (REIT Case Study)
Developed regression models to predict housing prices for a real estate investment trust. Used feature engineering and model evaluation to explore how square footage, bedrooms, and other variables impact pricing.


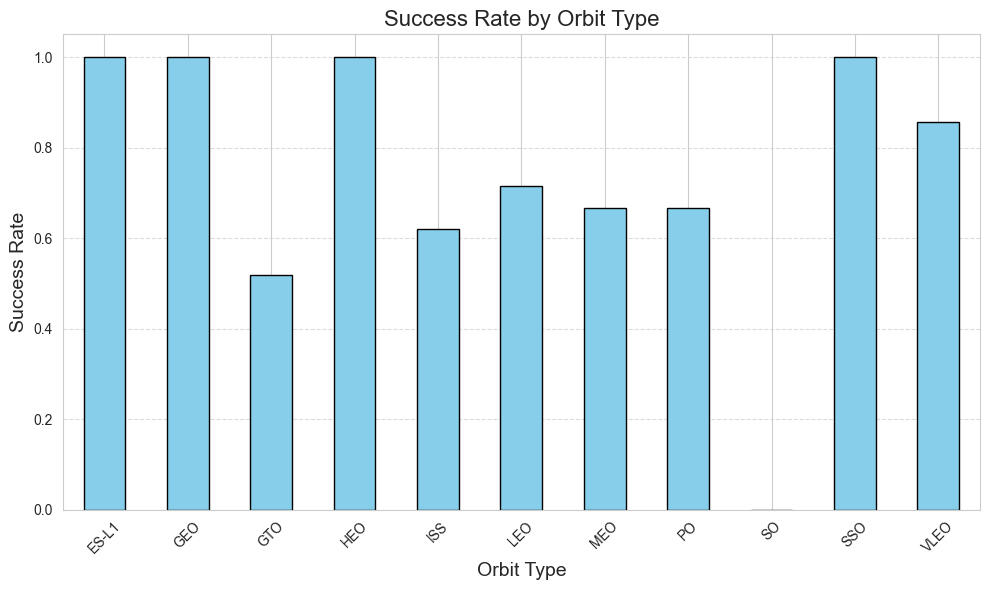
Mission Control: Predicting Falcon 9 Landings with Data Science
Used SpaceX API data and machine learning to predict whether Falcon 9 rockets land successfully. Includes data extraction, wrangling, feature engineering, classification modeling, and bonus visualizations.
Tools and techniques I rely on to turn data into decisions.
Tech Stack
Python
pandas
NumPy
scikit-learn
SQL
Tableau
Dash
matplotlib
seaborn
Jupyter
Data Skills
Data Cleaning
Data Wrangling
Exploratory Data Analysis
Feature Engineering
Machine Learning
ML Model Building
ML Model Evaluation
Cross-Validation
Dashboards
Data Visualization
Strengths
Strategic Thinking
Problem Solving
Storytelling
Attention-to-detail
Collaboration
Communication
Gen AI Model Training
AI Prompt Engineering
Adaptability
Creativity
Built to surface insights — and keep asking better questions | © 2025